



Canned pumpkin vs fresh isn’t close on paper: USDA puts a cup of canned at 1,906 µg RAE of vitamin A and 7.1 g of fiber, against 706 µg and 2.7 g for fresh boiled. Less water explains only part of that. Here’s why the charts online disagree, and how strong each answer is.
Ask whether canned pumpkin (tinned pumpkin, in the UK) or fresh has more vitamin A, and you can collect a different answer from page after page. One comparison table that ranks for the question hands the win to fresh, 961 mcg to 754. Another page says a cup of canned covers 763% of your daily vitamin A. The next says 212%, and a university extension page says fresh is the richer of the two.
Most of those numbers can be traced to a cause, and a few are simply wrong. Below: what the two USDA records say about one cup, why the charts drift so far apart, how much of the gap is really water, what the law allows inside a can labeled pumpkin, and where pie mix fits in.
What the evidence says
Solid · Canned carries more vitamin A per cup than boiled fresh. 1,906 against 706 µg RAE in 245 g (USDA FDC 168450 and 168449); the canned carotene figures come from lab analysis of five samples.
Moderate · Canned carries more fiber per cup. 7.1 g against 2.7 g in the same two records, about a quarter of the Daily Value against a tenth; USDA lists no sample count for either.
Moderate · Less water explains part of the gap. 10.03 g of solids per 100 g against 6.31 g accounts for about 1.6 of the 2.7 times.
Limited · The rest fits a different plant in the can. One lab study of Brazilian squashes plus Illinois Extension’s variety list; we found no study that has measured U.S. cans against fresh pumpkin this way.
The catch · USDA’s fresh number was calculated, not measured. It was derived from the raw pumpkin record, whose beta-carotene came from other food tables. And the five canned samples ranged from 3,060 to 10,820 µg of beta-carotene per 100 g.
1. Canned Pumpkin vs Fresh: What Does USDA Say a Cup Holds?
About 2.7 times the vitamin A and 2.6 times the fiber, in canned’s favor. On the same 245 g (1 cup) serving, USDA FoodData Central puts plain canned pumpkin (SR Legacy, FDC 168450) at 1,906 µg RAE of vitamin A and 7.1 g of fiber. Boiled, drained fresh pumpkin (FDC 168449) comes to 706 µg RAE and 2.7 g.
Fresh isn’t shut out. It carries lutein, 2,484 µg a cup, where the canned record shows none, plus a little more potassium and vitamin C. The table puts both records side by side, with one row most comparisons leave out: how each carotene figure was obtained.
| Per cup (245 g) | Canned, FDC 168450 | Fresh, boiled and drained, FDC 168449 |
|---|---|---|
| Vitamin A | 1,906 µg RAE (212% DV) | 706 µg RAE (78% DV) |
| Beta-carotene | 17,003 µg | 5,135 µg |
| Alpha-carotene | 11,748 µg | 6,652 µg |
| Lutein + zeaxanthin | 0 µg | 2,484 µg |
| Fiber | 7.1 g (25% DV) | 2.7 g (10% DV) |
| Calories | 83 kcal | 49 kcal |
| Water | 220.4 g | 229.5 g |
| Potassium | 505 mg (11% DV) | 564 mg (12% DV) |
| Iron | 3.41 mg (19% DV) | 1.40 mg (8% DV) |
| Vitamin C | 10.3 mg (11% DV) | 11.5 mg (13% DV) |
| Vitamin K | 39.2 µg (33% DV) | 2.0 µg (2% DV) |
| Where the carotene figures come from | lab analysis, five samples (lutein: one) | calculated from USDA’s raw pumpkin record |
Both columns: USDA FoodData Central, SR Legacy, 1 cup = 245 g (the canned record’s “cup”, the boiled record’s “cup, mashed”), both without salt. Percent Daily Values use FDA reference values: vitamin A 900 µg RAE, fiber 28 g, potassium 4,700 mg, iron 18 mg, vitamin C 90 mg, vitamin K 120 µg.
For scale, a cup of canned carries about ten times the vitamin A of a whole medium red bell pepper, which USDA puts at 187 µg RAE (FDC 170108). The calorie row tells the same story as the vitamin A row: 83 against 49, because a cup of canned holds more pumpkin and less water. Section 3 weighs how far that explanation goes.
2. Why Do Canned vs Fresh Pumpkin Nutrition Charts Disagree?
Mostly because they aren’t measuring the same thing. Some charts use International Units (IU) and a retired Daily Value, some print numbers that match no USDA record, and almost none mention that USDA’s fresh figure was calculated rather than measured. Here are seven claims we found on September 24, 2026, checked against the USDA records:
- “212% of the Daily Value” for a cup of canned. Correct: 1,906 µg RAE divided by the current 900 µg RAE.
- “763%” for the same cup. Also correct, on the old yardstick: USDA lists that cup at 38,129 IU, and 5,000 IU was the Daily Value FDA set in 1993 and replaced in 2016.
- “Canned 754 mcg, fresh 961 mcg.” Backwards, and a match for neither record. The same table swaps potassium too, giving canned 564 mg and fresh 505 mg, the reverse of USDA. At least one search engine’s AI summary was repeating these figures.
- “16,405 IU canned, 7,400 IU fresh.” Matches neither record, even in IU. USDA gives 38,129 IU and 14,100 IU per cup.
- “0.5 mg of beta-carotene” in a cup of fresh cooked. USDA’s record gives 5.1 mg, ten times more. The same page’s 17 mg for canned is right.
- “More than 100% of the Daily Value” for fresh. USDA gives 706 µg RAE, which is 78%.
- “Fresh is richer in vitamin A,” and, on the same page, higher in fiber. Both run the other way in USDA’s records.
Three kinds of cause cover all seven: the unit, the yardstick, and numbers that are simply wrong. A fourth sits under all of them, the calculated fresh figure in section 3. IU and µg RAE aren’t interchangeable. FDA’s 2019 guidance on converting label units says there is no direct conversion factor from IU to mcg RAE on its own; you have to know which carotenoids or retinol the food contains. Run the same can through the 1993 Daily Value and you get 763%. Run it through the current one and you get 212%. The pumpkin didn’t change. The ruler did.
3. Does Less Water Explain the Gap?
Partly: it accounts for about 1.6 of the 2.7 times. The explanation you’ll see most often, that canning cooks off water and concentrates what’s left, holds as far as it goes. Per 100 g, the canned record carries 10.03 g of solids (everything that isn’t water) and the boiled record 6.31 g. That difference alone would give canned about 1.6 times the vitamin A.
The records show 2.7. Put vitamin A on a per-gram-of-solids basis and canned still carries 77.6 µg RAE against 45.6, about 1.7 times as much. Fiber behaves the same way: it makes up 28.9% of canned pumpkin’s solids and 17.4% of boiled pumpkin’s.
Nothing in the records suggests the can itself adds vitamin A. USDA’s grading standard describes the process as washing, stemming, cutting, steaming and reducing to a pulp, then heat processing in sealed containers. The rest of the gap lines up with two things, and neither is proven.
A different plant. Illinois Extension lists the pumpkins grown for processing, Dickinson Field among them, as all Cucurbita moschata, tan-skinned and “widely used for commercially canned pumpkin.” A 2007 study in the Journal of Agricultural and Food Chemistry by Azevedo-Meleiro and Rodriguez-Amaya found beta- and alpha-carotene dominating in C. moschata, while lutein and beta-carotene dominated in C. maxima and C. pepo. USDA’s canned record fits that pattern, with 4,795 µg of alpha-carotene per 100 g and zero lutein in its one analyzed sample. The limit: the study analyzed squashes sold in Campinas, Brazil, not Dickinson pumpkins or American cans.
A calculated number. USDA’s fresh figure was never measured on boiled pumpkin. The record’s own notes say its carotenes are “based on another form of the food,” adjusted for solids with retention factors, and the raw record behind it took its beta-carotene from “other tables of food composition.” The canned beta-carotene comes from lab analysis of five samples. So USDA isn’t comparing two measured pumpkins. It’s comparing a measured can with a calculated pumpkin in general.
4. Is Canned Pumpkin Actually Pumpkin?
It may be pumpkin, sweet squash or a mix of the two, and U.S. rules allow the “pumpkin” label for all three. Under FDA Compliance Policy Guide Sec. 585.725, first issued in 1969 and last reissued in 1988, a product made from golden-fleshed, sweet squash, or from that squash mixed with field pumpkin, may be called “pumpkin.” FDA writes that it has advised canners this way since 1938 and treats the name as being in “essential compliance” with the common-or-usual-name rules in section 403(i) of the Federal Food, Drug, and Cosmetic Act.
USDA’s grading standard for canned pumpkin and canned squash, in effect since January 20, 2017, uses a single product description for both: “golden fleshed, firm shelled, sweet varieties of either pumpkins or squashes.” On the grader’s form, the two are one product.
One detail we didn’t find on any of the pages we checked: the FDA text names field pumpkin as Cucurbita pepo and the sweet squash as Cucurbita maxima, while the processing pumpkins on Illinois Extension’s list are C. moschata. The 1988 wording doesn’t name the species most likely to be in the can today. That’s a note on the wording, not a sign that anything in the can is mislabeled.
5. Is Canned Pumpkin as Healthy as Fresh? It May Be the Better Buy, Lutein Aside
On most rows of the USDA comparison, canned may be the better buy: more vitamin A, fiber, iron and vitamin K per cup. Fresh keeps the lutein, a touch more potassium and vitamin C, and 34 fewer calories. Both unsalted records carry almost no sodium, 12 mg and 2 mg a cup.
The vitamin A in both arrives as carotenes, which the body converts as it needs them. The Linus Pauling Institute at Oregon State University puts the RDA at 700 µg RAE a day for women and 900 µg for men, and notes that the 3,000 µg upper limit does not apply to vitamin A from carotenoids. Its carotenoid review adds that high doses of beta-carotene have never been found to cause vitamin A toxicity, possibly because conversion slows when the body’s stores are high. Eat a lot of carotene-rich food and your skin may turn faintly yellow (carotenodermia), which the institute says isn’t linked to any underlying health problem and fades when intake drops.
The pregnancy warnings about vitamin A concern preformed vitamin A (retinol and its esters), not the carotenes in pumpkin. If you take a supplement that contains vitamin A, count it separately and ask your doctor or pharmacist.
What USDA’s numbers can’t show is how much you absorb. Carotenoids are best absorbed with some fat in the meal; the institute puts the amount that appears sufficient at 3 to 5 g, and notes that chopping, puréeing and cooking generally raise bioavailability. A heat-processed puree may therefore give up its carotene a little more easily than chunks of boiled pumpkin. In a PubMed search on September 24, 2026, we found lab-dish studies of pumpkin carotenoids but no study in people comparing canned pumpkin with fresh. The fat side showed up in our fall salad, where a fat-free dressing let almost none of the carotenoids reach the blood, and the cooking side in why cooked tomato beats raw for lycopene.
Fresh pumpkin’s edge on paper is lutein, a carotenoid the body can’t turn into vitamin A and that the institute describes as taken up selectively into the macula of the eye. It’s also the softest row in the table: the canned zero comes from a single analyzed sample, and the fresh figure, like its vitamin A, was calculated from other food tables. If lutein is what you’re after, zucchini carries about twice as much per 100 g: 2,125 µg against boiled pumpkin’s 1,014.
6. Pumpkin Pie Mix vs Pumpkin Puree: What Changes in the Can?
Sugar and spice go in, and the numbers move with them. Weight for weight, USDA’s record for canned pumpkin pie mix (FDC 169273) gives 245 g of it 255 calories and 510 mg of sodium; the same weight of plain canned pumpkin has 83 calories and 12 mg. Its own cup weighs 270 g and carries 281 calories and 562 mg of sodium, about a quarter of the 2,300 mg Daily Value.
The vitamin A drops by almost half, probably because the pumpkin shares the can with sweetener and spice: 1,017 µg RAE in 245 g of pie mix against 1,906 in plain.
Two entries need care. The record carries no sugar figure at all, so the label on your can is the only place to find one. And it lists 8.3 g of fiber per 100 g, more than plain canned pumpkin’s 2.9 g, even though the pumpkin shares the can with sugar and spice. USDA gives no sample count for either fiber figure, so we report both as published and don’t try to explain the gap. For baking, our pumpkin cinnamon rolls, no yeast, spell out why the recipe wants the puree rather than the filling.
How to Use Canned Pumpkin in Your Kitchen
Read the ingredient list, not the picture on the front. Plain canned pumpkin lists pumpkin and nothing else, and that’s the product behind FDC 168450. A 425 g (15 oz) can holds about 1¾ cups at USDA’s 245 g cup.
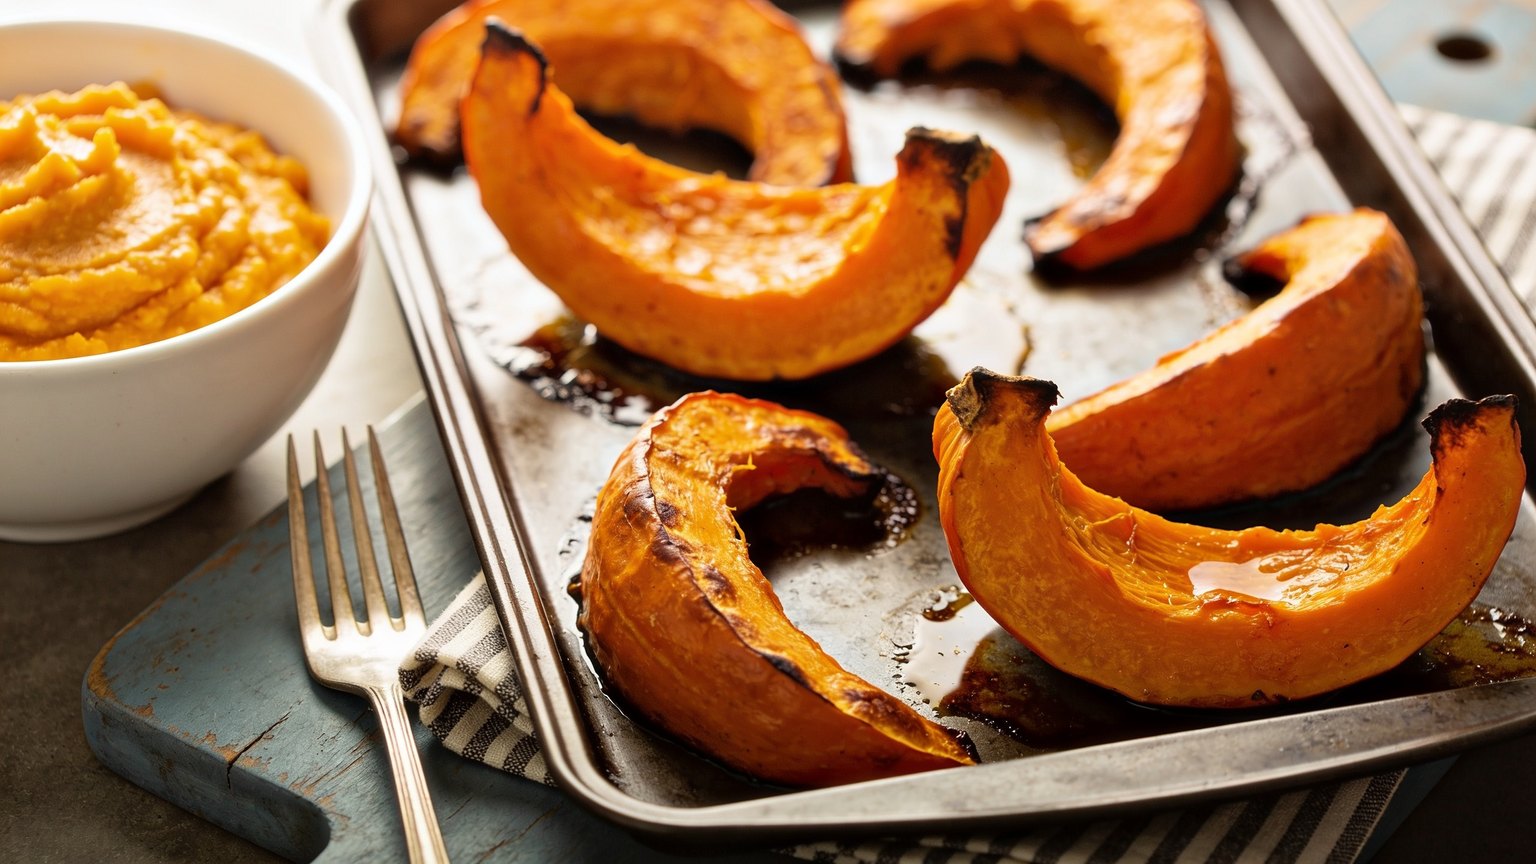
If you make your own puree, skip the pot of water. USDA’s raw pumpkin holds 91.6 g of water per 100 g and its boiled record 93.69 g, so boiling makes pumpkin wetter, not drier. Canners steam the flesh and reduce it to a pulp. At home, roasting or steaming and then letting the puree drain in a sieve should bring it closer to that texture.
Pick a small pie pumpkin over a carving one; Illinois Extension lists Small Sugar, also sold as New England Pie, as the standard pie type. And if tinned pumpkin isn’t on your shelf, roasted butternut squash is the usual stand-in: USDA puts baked butternut at 558 µg RAE per 100 g against 778 for canned pumpkin (FDC 169296 and 168450), and our no-bake pumpkin protein balls explain how much to use when you swap.
Canned Pumpkin Nutrition Facts
Frequently Asked Questions
Is canned pumpkin cooked?
Yes. USDA’s grading standard describes canned pumpkin as steamed and reduced to a pulp, then heat-processed in sealed containers, so it’s cooked before it reaches the shelf. A pie or a batch of muffins cooks it a second time.
Can I use fresh pumpkin instead of canned?
Yes, cup for cup, once it’s drained. Boiled pumpkin is wetter than canned, 93.69 g of water per 100 g against 89.97 g, so let a home puree sit in a sieve until it’s as thick as the can’s, or roast instead of boiling. By USDA’s figures you’ll get less vitamin A per cup: 706 µg RAE against 1,906.
Does canned pumpkin have fiber?
Yes: 7.1 g in a 245 g cup, about a quarter of the 28 g Daily Value, per USDA FDC 168450. Boiled fresh pumpkin carries 2.7 g in the same cup, partly because more of every spoonful is water.
The Bottom Line: Canned or Fresh Pumpkin?
By USDA’s own records, a cup of plain canned pumpkin carries 2.7 times the vitamin A and about 2.6 times the fiber of boiled fresh, and less water explains only part of that. The charts that say otherwise are mixing units, using a retired Daily Value or printing numbers that match no USDA record. The caveat that does hold is that USDA’s fresh number was calculated, not measured. Buy the can that lists only pumpkin, keep pie mix for pie, and put the rest to work in our pumpkin protein balls.
Sources
- USDA FoodData Central — “Pumpkin, canned, without salt” (SR Legacy, FDC ID 168450). https://fdc.nal.usda.gov/food-details/168450/nutrients
- USDA FoodData Central — “Pumpkin, cooked, boiled, drained, without salt” (SR Legacy, FDC ID 168449). https://fdc.nal.usda.gov/food-details/168449/nutrients
- USDA FoodData Central — “Pumpkin, raw” (FDC ID 168448), “Pumpkin pie mix, canned” (FDC ID 169273), “Squash, winter, butternut, cooked, baked, without salt” (FDC ID 169296), “Peppers, sweet, red, raw” (FDC ID 170108), all SR Legacy. https://fdc.nal.usda.gov/
- U.S. Food and Drug Administration — CPG Sec. 585.725, “Pumpkin” — Labeling Articles Made from Certain Varieties of Squash (issued 1969, reissued December 1988). https://www.fda.gov/regulatory-information/search-fda-guidance-documents/cpg-sec-585725-pumpkin-labeling-articles-made-certain-varieties-squash
- U.S. Food and Drug Administration, August 2019 — “Converting Units of Measure for Folate, Niacin, and Vitamins A, D, and E on the Nutrition and Supplement Facts Labels: Guidance for Industry.” https://www.fda.gov/media/129863/download
- U.S. Food and Drug Administration — “Daily Value on the Nutrition and Supplement Facts Labels.” https://www.fda.gov/food/nutrition-facts-label/daily-value-nutrition-and-supplement-facts-labels
- USDA Agricultural Marketing Service — “United States Standards for Grades of Canned Pumpkin and Canned Squash,” effective January 20, 2017 (81 FR 93572), §52.2741. https://www.ams.usda.gov/grades-standards/canned-pumpkin-and-canned-squash-grades-and-standards
- University of Illinois Extension — “Pumpkin Varieties.” https://extension.illinois.edu/pumpkins/pumpkin-varieties
- Journal of Agricultural and Food Chemistry, 2007 — Azevedo-Meleiro CH, Rodriguez-Amaya DB. “Qualitative and quantitative differences in carotenoid composition among Cucurbita moschata, Cucurbita maxima, and Cucurbita pepo.” 2007;55(10):4027-4033. https://pubmed.ncbi.nlm.nih.gov/17444652/
- Linus Pauling Institute, Oregon State University — Micronutrient Information Center, “Vitamin A.” https://lpi.oregonstate.edu/mic/vitamins/vitamin-A
- Linus Pauling Institute, Oregon State University — Micronutrient Information Center, “Carotenoids.” https://lpi.oregonstate.edu/mic/dietary-factors/phytochemicals/carotenoids